


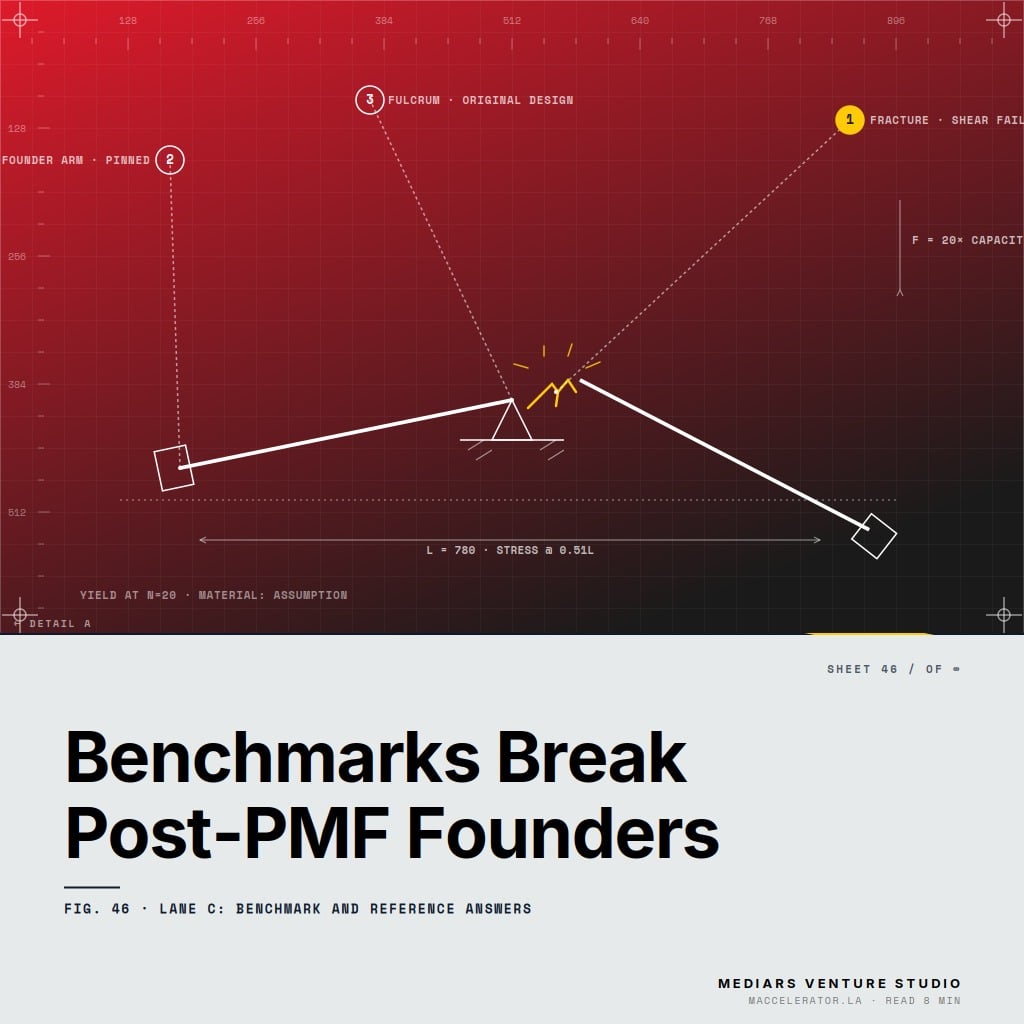
Picture a founder on a board call at $1.2M ARR. Someone asks: “How does our churn compare to peers?” She cites a number from a public SaaS report. The room nods. The problem? That report was built from companies ten times her size, running a completely different revenue model. Lane C: Benchmark and Reference Answers is the discipline of selecting stage-, model-, and motion-matched external benchmarks and having defensible, pre-thought responses ready for the predictable “how do we compare?” question. It matters because post-PMF founders are judged against reference points constantly — and the wrong one costs you the round, the hire, or the narrative.
Here is what we have seen across 500+ founders in 30 countries: the most common post-PMF stumble is not a lack of data. It is applying the wrong reference point. Most founders are drowning in benchmarks but starving for the right ones.
That is the gap this article closes.
What “Lane C” Actually Means — And Why It’s Not a Data Problem
Think of your metrics operating in three lanes.
Lane A is your own historical trend — how this quarter compares to last. Lane B is your stated plan — the targets you committed to. Lane C is external: benchmarks and reference answers from peers at a comparable stage and model.
Most founders obsess over Lane A and B. They track their own growth religiously. But they cannot contextualize either without Lane C.
Is 4% monthly churn good? You cannot answer that from your own trend line alone. You need a valid external reference.
“Reference answers” is the part people miss. It means having a defensible response to the predictable comparison questions — not scrambling live in front of an investor. The question “how does your CAC compare?” is not a surprise. It arrives in every serious conversation.
“Founders who nail Lane C walk into high-stakes conversations with calibrated confidence. The ones who don’t either over-apologize for healthy metrics or over-claim on weak ones. Both tank credibility.”
The founders who get this right do not have more dashboards. They have the right three numbers and a clear reason those numbers apply to them.
Why Benchmarking Breaks Down Right After Product-Market Fit
Pre-PMF, nobody expects polished comparisons. You are hunting for fit. The rules are forgiving.
Post-PMF, the stakes invert. You are raising a round. You are hiring senior operators who have seen “good” at scale. You are defending unit economics to partners who benchmark for a living.
This is where the trap springs. The most-cited public benchmarks — the SaaS Rule of 40, media CAC multiples, DTC repeat-purchase rates — are mostly drawn from late-stage, well-capitalized companies.
That reference set quietly makes healthy early-scale numbers look broken.
Your burn multiple looks alarming next to a Series C company that already fixed its efficiency. Your retention looks shaky next to a decade-old platform. You are comparing a sprinter at mile one to a marathoner at mile twenty.
Business model breadth makes it worse. A services firm, a marketplace, and a product company at the same $1M ARR have wildly different “good” numbers. Generic benchmarks flatten all of that into one misleading line.
Widely circulated benchmark reports skew toward survivorship bias — they sample the companies that survived long enough to report. We have watched misapplied benchmarks cause two failures across our founder base: premature panic over a category-leading metric, and false comfort over a genuinely weak one. We break down stage-appropriate benchmark data weekly in the AI Acceleration newsletter.
Key Takeaways
- Lane C is a thinking discipline, not a data pile. The right three benchmarks beat thirty dashboards.
- A benchmark must clear three filters — stage match, model match, and motion match — to be a valid reference.
- Post-PMF is when wrong benchmarks turn dangerous because investors and senior hires are already benchmarking you.
- “Good” means answering “how do we compare?” in under 30 seconds with a qualified reference set and a consistent team narrative.
- Most public benchmarks fail at least one filter because they draw from later-stage, survivorship-biased samples.
Benchmarks Vs. Reference Answers: They’re Not the Same Thing
A benchmark is a number. A reference answer is a number plus the reasoning that makes it defensible for your specific business.
A benchmark says: “Median net revenue retention is 110%.” A reference answer says: “Our NRR is 118%, which is strong for a usage-based model at our stage, because expansion compounds with customer consumption rather than seat count.”
See the difference? One is trivia. The other is a narrative you can defend when challenged.
The Three Questions That Tell You If a Metric Deserves a Benchmark
Before you cite any benchmark, run it through three filters. A valid reference answer clears all three. Most public benchmarks fail at least one.
1. Stage match. Is this benchmark from companies at your ARR and funding band — not five stages ahead? A number from a $50M ARR company tells you almost nothing about $1M ARR reality.
2. Model match. Same revenue mechanics? Recurring, transactional, usage-based, and project-based businesses behave differently. Comparing usage-based churn to seat-based churn is comparing two different physics.
3. Motion match. Same go-to-market intensity? Product-led growth, sales-led, and retail motions produce entirely different CAC and payback profiles.
Consider a usage-based infrastructure founder at roughly $1.2M ARR we worked with. He was benchmarking his churn against seat-based SaaS averages and panicking. Every board call turned into a defense.
Once he reframed around usage expansion — the right model match — the story flipped. The board narrative moved from “we have a churn problem” to “we have a healthy expansion curve.” Same numbers. Correct reference frame.
“The number almost never changes in these conversations. The reference frame changes. And that is the entire difference between a down-round framing and a strong one.”
What a Healthy Benchmarking Practice Looks Like (Across Business Models)
You do not need to know the full method to recognize the destination. Here is what “good” looks like when Lane C is working.
You answer “how do we compare?” in under 30 seconds with a qualified reference set. No scrambling. No guessing. In the broken state, you freeze or cite something irrelevant.
Your benchmarks shift as you cross ARR thresholds. You are not using the same reference number at $300K and $3M. The broken state uses one stale benchmark for years.
You defend a metric that looks “off” by naming why your model differs. A marketplace founder explains why her take-rate trajectory beats generic SaaS gross-margin expectations. The broken state apologizes for healthy numbers.
Your team shares the same reference answers. The story stays consistent across fundraising, hiring, and sales. In the broken state, three people give three different answers to the same investor.
Across founders who reached this calibrated state, we have seen faster investor conversations and fewer derailments on “is this good?” questions. A mobility marketplace founder stopped losing twenty minutes per pitch defending a metric that was, in fact, category-leading.
Post-PMF founders calibrating these questions alongside peers tend to move faster — that is part of why operators join the Elite Founders community.
“We Can Figure This Out Ourselves” — And Other Things That Cost Founders a Round
Three objections come up constantly. Each one is actually a reason the problem matters now.
“We’re too early-stage for this.” If you are post-PMF and ever talking to an investor, a senior hire, or a growth partner, you are already being benchmarked by them. The only question is whether you control the reference frame or they do.
“We have no budget for this.” Lane C is primarily a thinking discipline, not a spend. The real cost is the mispriced round or the wrong senior hire you make by trusting a benchmark that never fit your model.
“We’ll figure it out ourselves.” You can. But survivorship bias means most founders only learn which benchmark was wrong after a conversation goes sideways. Learning the pattern from others compresses that timeline from quarters to days.
We have watched founders discover their “bad” metric was category-leading only after a down-round framing locked in. We have watched others over-hire against a benchmark that did not fit their motion. Both are expensive lessons that Lane C prevents.
The Data Behind Why Founders Misread Their Own Numbers
Three trends are reshaping how benchmarking works. Watch them.
Benchmark fragmentation. Model-specific and vertical-specific benchmark sets are replacing one-size-fits-all SaaS metrics. The era of a single “good” churn number is ending.
Real-time, AI-driven benchmarking. Stale annual reports are losing relevance. Expectations are rising that founders carry current reference answers, not last year’s figures.
Context-adjusted scrutiny. Since 2022, investors shifted from pure growth toward efficiency metrics — burn multiple, net revenue retention. They now probe context, not raw numbers. The reference answer matters more than the figure.
Across the 500+ founders we have observed, the questions themselves have changed. Five years of enterprise experience building reporting systems at scale taught us one thing: the number is never the story. The frame is.
If you want to see how operators at your stage think through these questions, join one of our Founders Meetings. Limited to founders ready to calibrate their numbers honestly.
FAQ
What is Lane C: Benchmark and Reference Answers?
Lane C is the discipline of selecting stage-, model-, and motion-matched external benchmarks and preparing defensible reference answers to the predictable “how do we compare?” question. It sits alongside Lane A (your historical trend) and Lane B (your stated plan).
Why is Lane C important for startups?
Post-PMF, investors and senior hires benchmark you constantly. The wrong reference point makes healthy metrics look broken or weak metrics look fine — both damage credibility and can m
Lane C lets you control the frame, defend your numbers, and keep the narrative consistent across fundraising, hiring, and sales.
How do you implement Lane C: Benchmark and Reference Answers?
Start by filtering every benchmark through three questions — stage match, model match, motion match. Keep only references that clear all three. Then build short, defensible reference answers for your top three or four metrics, and align your team so everyone tells the same story. Review and update these as you cross each ARR threshold.